From your restaurant's data to clear decisions.
Milton connects the sources you already use, turns them into structured restaurant data and uses AI to explain what is happening and what deserves your attention.
Five steps, from scattered information to a decision.
This is what happens inside Milton, without your team having to change how it works.
- 01
Your sources
POS, invoices, recipes, Excel and other files. Milton works with what your restaurant already generates.
- POS
- Invoices
- Recipes
- Files
- 02
Structured data
It recognizes supplier, product, quantity and price on your invoices, organizes your recipes and links every sale to its dish.
- 03
KPIs and margins
It calculates sales, cost of goods (COGS) and margin per dish from data that is already connected.
- 04
AI analysis
It detects changes, connects cause and effect and prioritizes what deserves your attention.
- 05
Decisions
You get it in your daily briefing or ask Ask Milton, and decide what to do.
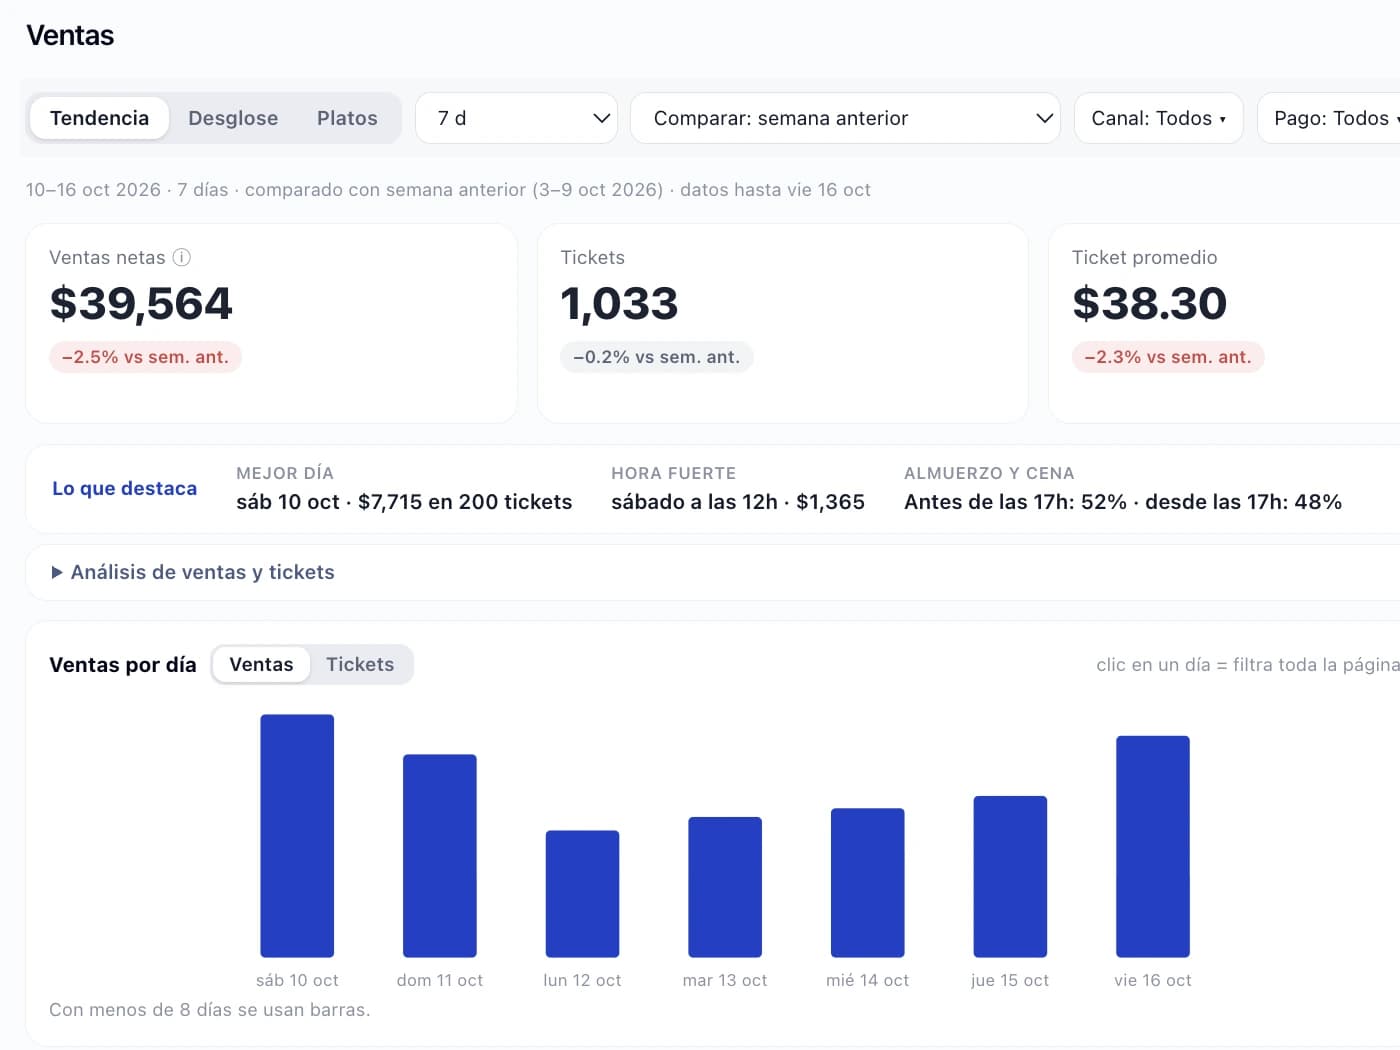
How much and when you sell, with real net sales.
Milton turns your POS data into a clear view of how your restaurant performs.
- Net sales, excluding tips
- What you sell, how much and when
- The restaurant's key indicators in one place
Understand what it costs you to sell what you sell, and why it changes.
Your invoices and recipes become clear costs per product, per supplier and per dish.
Cost of goods (COGS)
What it costs you to sell what you sell, calculated from your invoices and recipes.
- Cost per product and ingredient
- Updated with your invoices
- The basis for every dish's margin
Cost evolution
Which ingredients and products are getting more expensive.
- Price changes over time
- Which recipes use that ingredient
- How much it affects each dish's margin
Suppliers and purchasing
How your purchases are spread and who you depend on.
- Purchases by supplier
- Dependence on key suppliers
- How their prices affect your costs
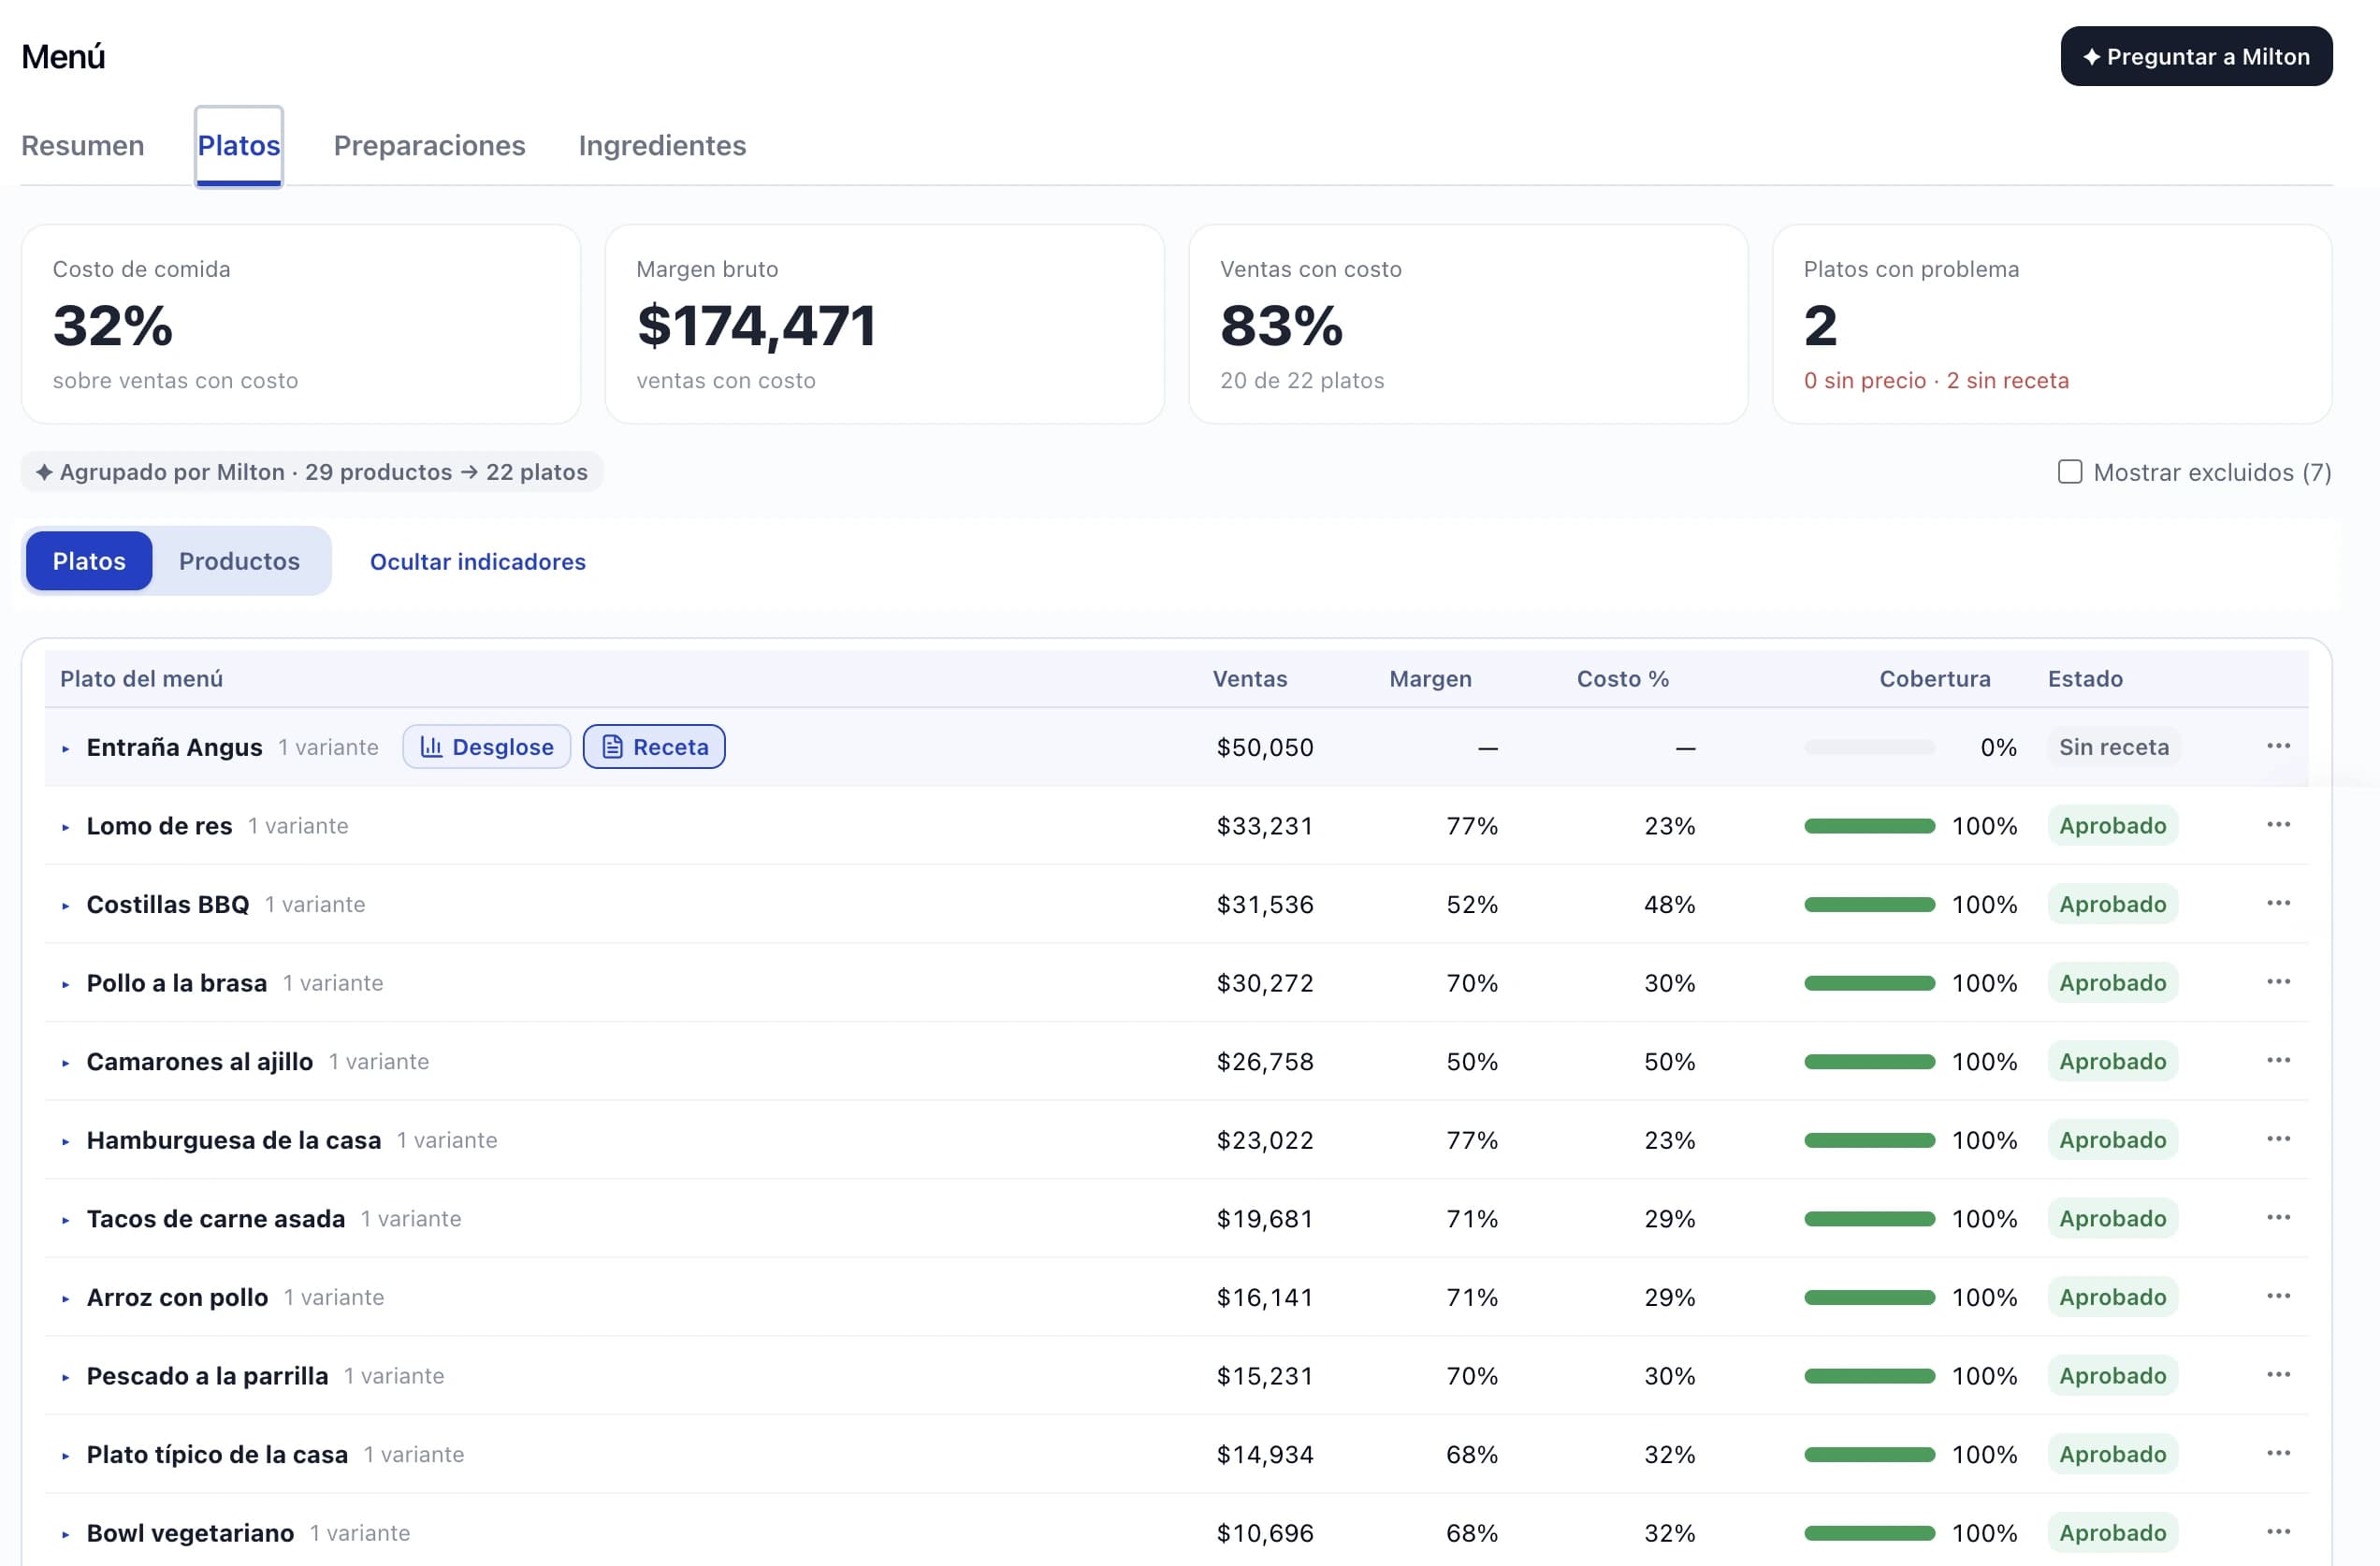
Where you win and where you lose, dish by dish.
Milton combines your sales, your recipes and the cost of every ingredient to show what each dish really contributes.
- The dishes that contribute most to your profitability
- The ones that sell a lot but leave little
- The costs that move each margin
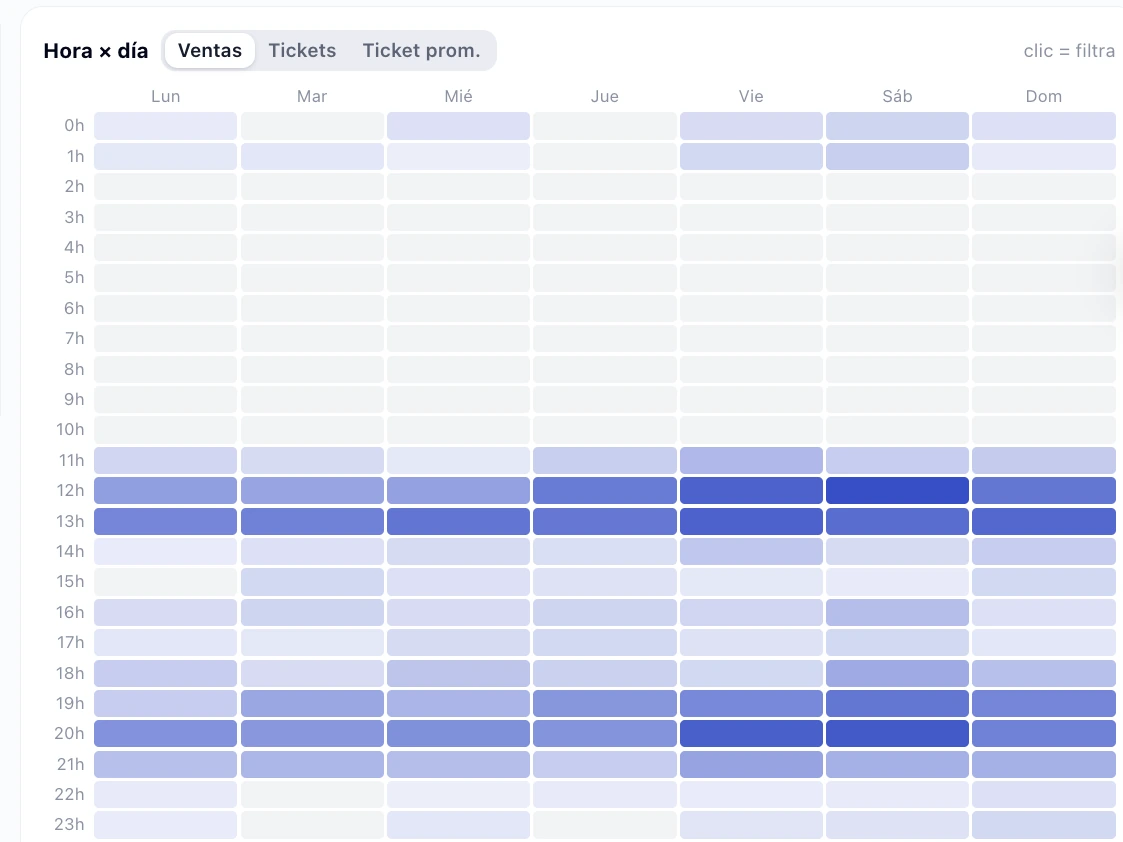
When you sell more and when you sell less.
A map by hour and day of the week to understand your restaurant's real rhythm.
- Strong and slow hours and days
- Patterns that repeat week after week
- A basis for deciding promotions, shifts and purchasing
What deserves your attention, without the noise.
Instead of one more dashboard someone has to check, Milton brings what matters to you.
- Prioritized changes, risks and opportunities
- What happened and why
- What to look at first
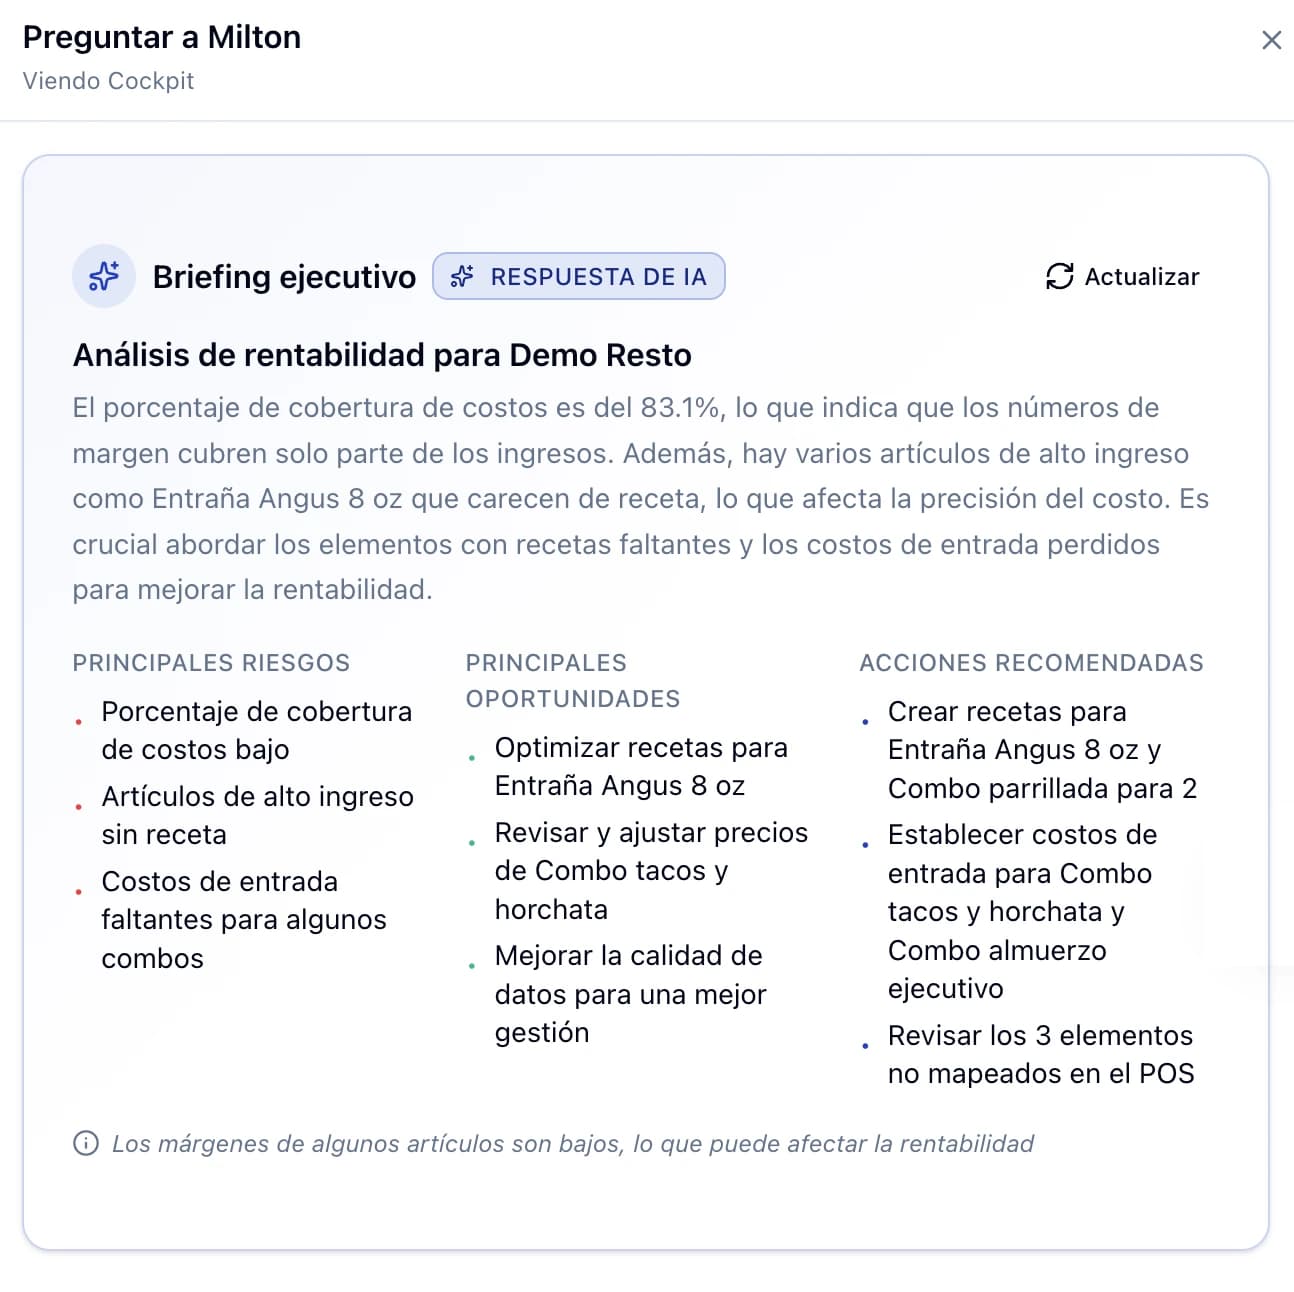
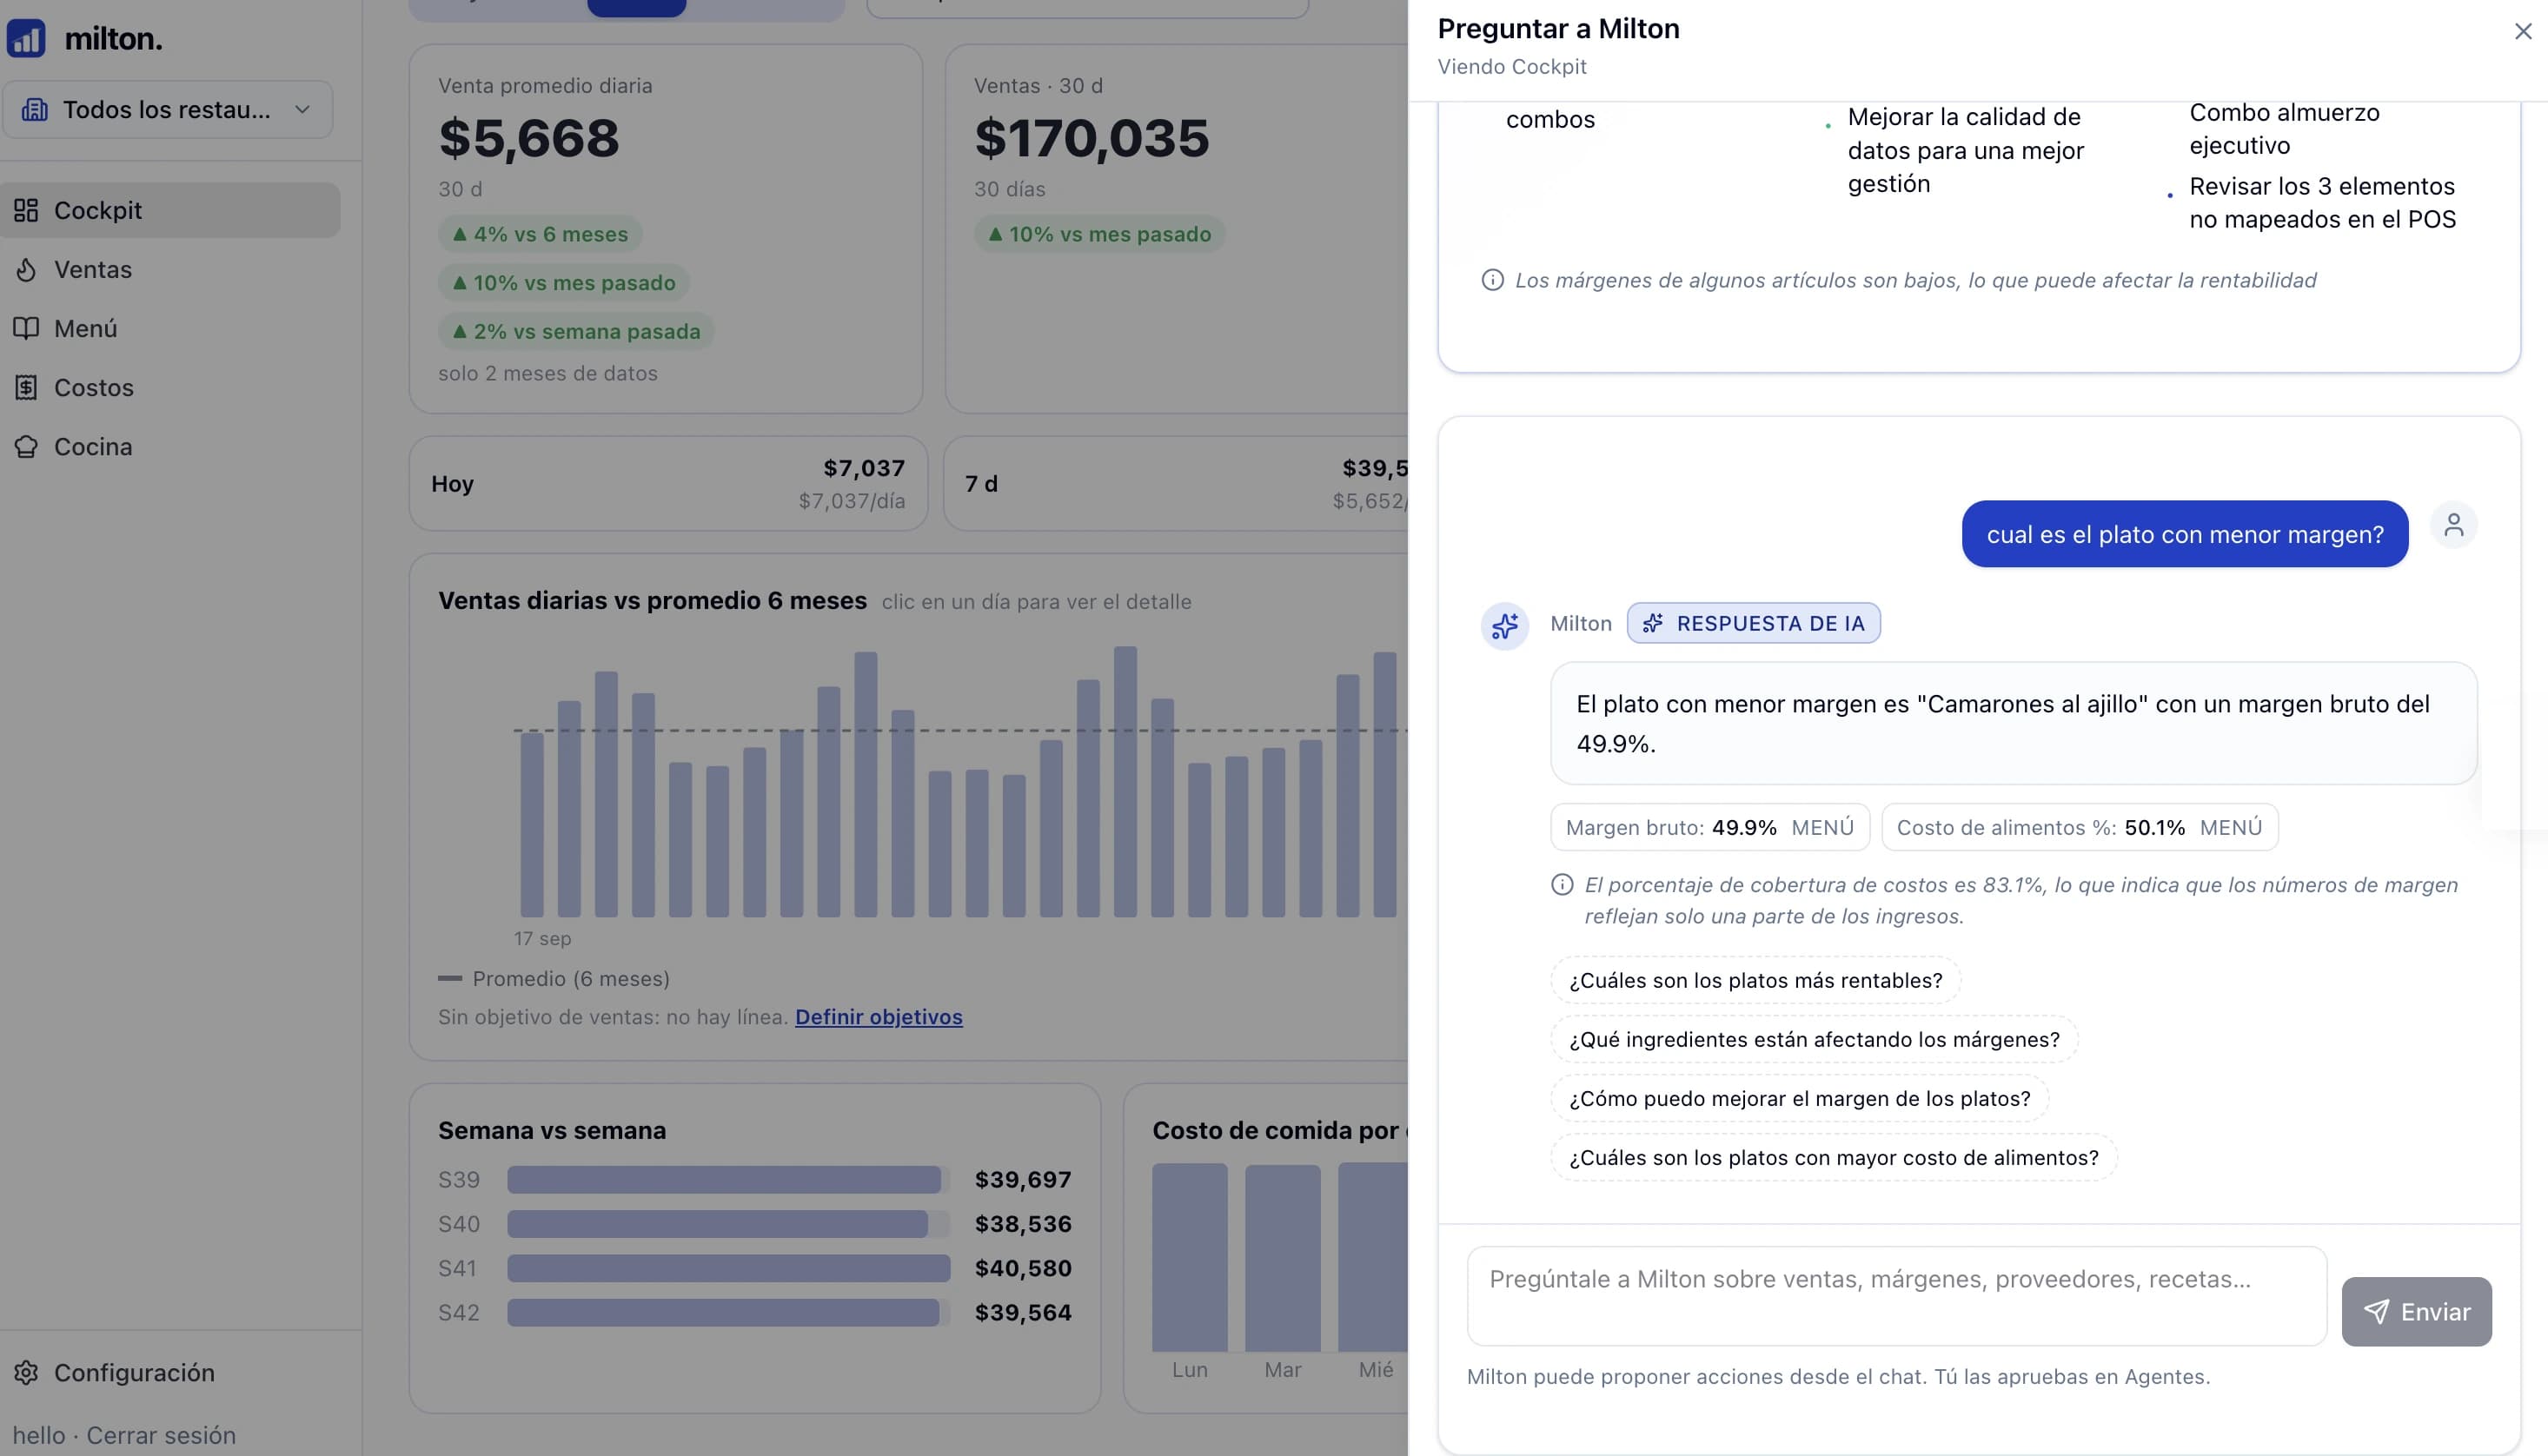
Ask about your business. Get answers from your data.
Ask questions in plain language and get answers based on your restaurant's connected data.
- No reports or formulas to build
- Answers based on your sales, costs and recipes
Example questions
- Which dish has the lowest margin?
- Which are the most profitable dishes?
- Which ingredients are affecting margins?
More intelligence for the whole operation.
These capabilities are part of Milton's product vision.
Inventory
What you have, what moves and what runs out, connected to your recipes and sales.
Waste and loss
Where product gets lost and how it affects your costs.
Demand and revenue forecasting
Anticipate how much you'll sell and when, to buy and plan better.
Workforce planning
Match shifts to your restaurant's real demand.
Get to know Milton.
Tell us how your restaurant runs and we'll show you how Milton helps you understand your margins.
Book a demo